Your employees are already walking and cycling to work. You're just not measuring it.
BRSR requires measured Scope 3 data — walking, cycling, and transit commutes all count. Deploy Altmo and turn estimates into GPS-verified numbers.
Tell me more
I'm ready to sign up
Trusted by organisations driving active mobility in India


Already on Altmo
Check if your employees are already tracking
Your employees may already walk, cycle, or take transit — and track it on Altmo. Enter your company name to see how many are on the platform. That's measured Scope 3 data you already have.
How it works
Three steps to get started
Employees download Altmo
Available on iOS and Android. Also compatible with Strava, Garmin, Suunto, and manual GPX uploads — works with what your employees already use.
They track commutes
Walking, cycling, and transit commutes — GPS-verified with distance, route, and impact calculated automatically.
You see the impact
Real-time dashboard with CO2, fuel saved, healthcare value, and adoption rates across all facilities.
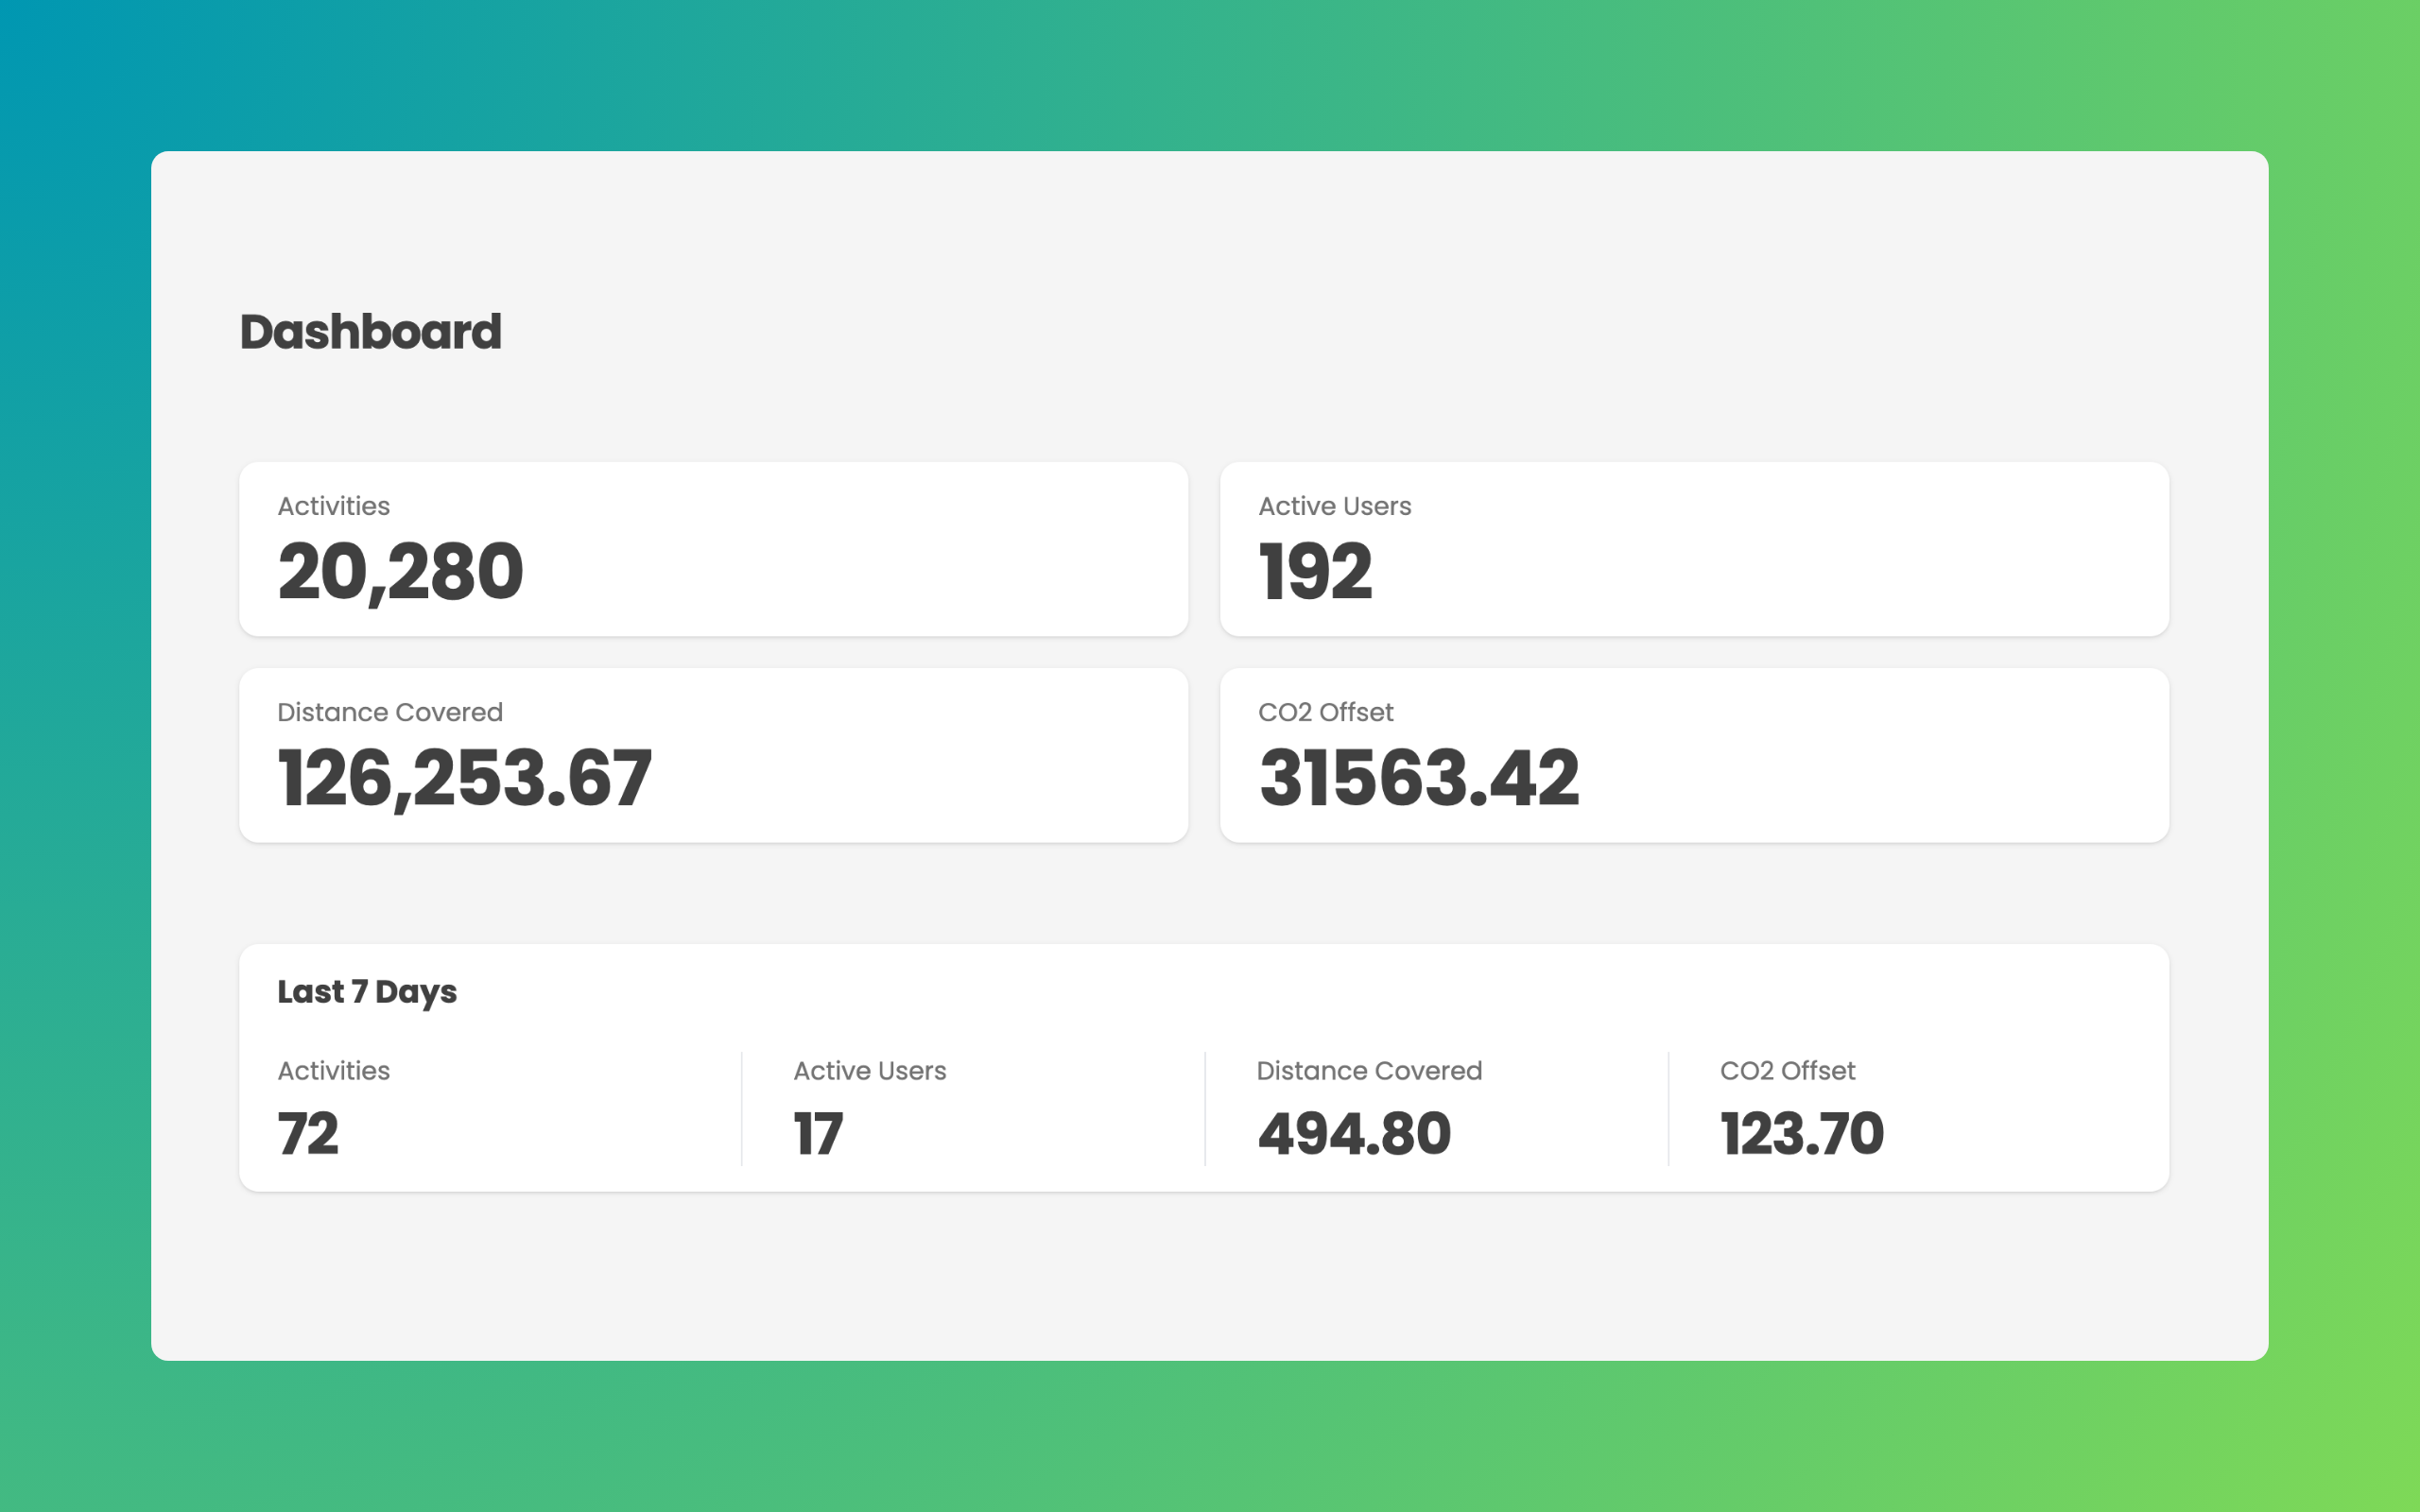
What you see on day one
Your employees' commutes, measured
GPS-verified. Not self-reported. Not estimated. Every walk, ride, and transit commute your employees already do — quantified.
ESG
30,000 kg
CO2e avoided per year
Scope 3 Cat 7 · BRSR · GRI 305 · CDP · ISO 14064
Health
59%
meet WHO activity targets
WHO HEAT v5.0 · MET-hours · ICMR-NIN compliant
Finance
₹8.9L
employee fuel savings per year
>4x ROI on platform cost · PPAC 2025 rates
Engagement
3.6x
sustained engagement vs one-off campaigns
Challenges · Leaderboards · Rank changes · Trophies
Based on 500 employees, 15% adoption, 8 km avg round-trip, 200 working days/year. View full methodology →
Bicycle fleet management
Facilities · FinanceDeploy bicycle fleets. Track every asset.
Position company bicycles at office campuses, metro stations, and bus stops. Employees cycle the first and last mile — public transport handles the rest.
Asset lifecycle
Every bicycle moves through a clear status pipeline. Know where every asset is at any moment.
Multi-location deployment
Assign bicycles to different office campuses or transit hubs. Each location gets its own contact person and GIS-mapped pickup point.
Maintenance & cost tracking
Log every service with date, description, and cost. See total maintenance spend per bicycle and calculate cost of ownership over time.
Utilisation analytics
Per-bicycle utilisation rates, revenue by month, and active rental counts. Know which bicycles earn their keep and which sit idle.
First & last mile connectivity
Employees cycle 2 km from the metro to the office — not 20 km door to door. Company bicycles at transit hubs make public transport the easy choice.
Enterprise ready
Built for enterprises. Audit-ready by default.
Every data point traces to a source, a methodology, and a timestamp. Your IT, legal, and procurement teams can verify everything.
ESG Compliance
BRSR (SEBI)
Scope 3 Category 7, Principle 6
GHG Protocol
Corporate Value Chain, Scope 3
GRI 305
Disclosure 305-3
CDP Climate
Section C6 + Scope 4 avoided
ISO 14064
Project-level GHG reductions
IFRS S2
Climate-related disclosures
Information Security
ISO 27001
Access control (A.5.15, A.8.2), Logging (A.8.15)
SOC 2 Type II
Logical access (CC6.1-CC6.3), Monitoring (CC7.2)
CIS Controls v8
Access control management (Control 6)
NIST 800-53
Account management (AC-2)
RBAC
15 roles with jurisdiction scoping
Immutable audit logs
All access changes logged with IP, reason, timestamp
SSO / SAML
Enterprise identity federation
API + rate limiting
JSON, CSV, Excel, XBRL export
Data Protection
DPDPA 2023
Reasonable security safeguards (Sec. 8)
GDPR
Data protection by design (Art. 25, 30)
Data hosted in India
Compliant with data localisation requirements
Encryption
TLS in transit, bcrypt + AES-256-GCM at rest
Privacy by design
Display names on leaderboards, no PII in exports
Account deletion
Users can delete account and associated data
No 3rd-party analytics
No tracking SDKs in mobile app
Procurement
GST registered
Annual contracts
PO-based invoicing
Pilot-friendly
No per-seat charges
Multi-year discounts
HRMS integration support
CO2 factor: 250 g CO2e/km (WRI IndiaGHGP 2015, Well-to-Wheel). Healthcare: WHO HEAT v5.0. All metrics GPS-verified with timestamped source attribution.
From ₹14,999/mo · No per-seat charges · See pricing →